Using Analytics Reports
Analytics reports help administrators track completion rates, pending documents, declined activity, signing turnaround, and document workflow trends.
Open Reports
- Open the dashboard.
- Click View Analytics, or open Reports from navigation.
- Review the summary cards at the top of the report.
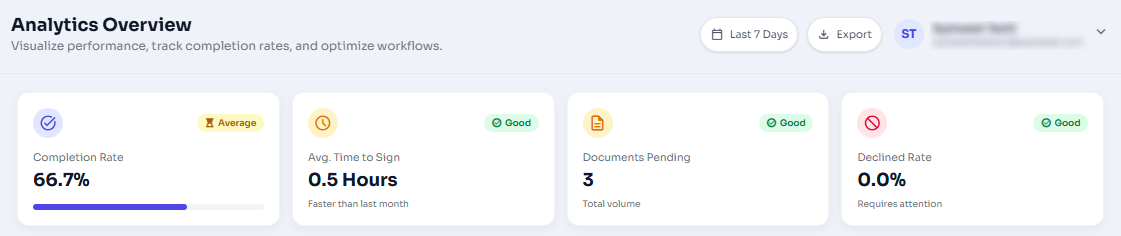
Figure 1: Analytics overview cards for completion rate, average time to sign, pending documents, and declined rate.
Change the Date Range
Use the date range menu to switch between recent report windows such as last 7 days, last 30 days, last 3 months, last 6 months, and last 1 year.
Review Charts
- Document Workflow Activity: Compares sent and completed documents over time.
- User Activity Heatmap: Shows recent completion activity by day.
- Status Distribution: Breaks documents into completed, pending, partially signed, drafts, declined, and recalled.
- Status Overview: Summarizes document outcomes in a ring view and count list.
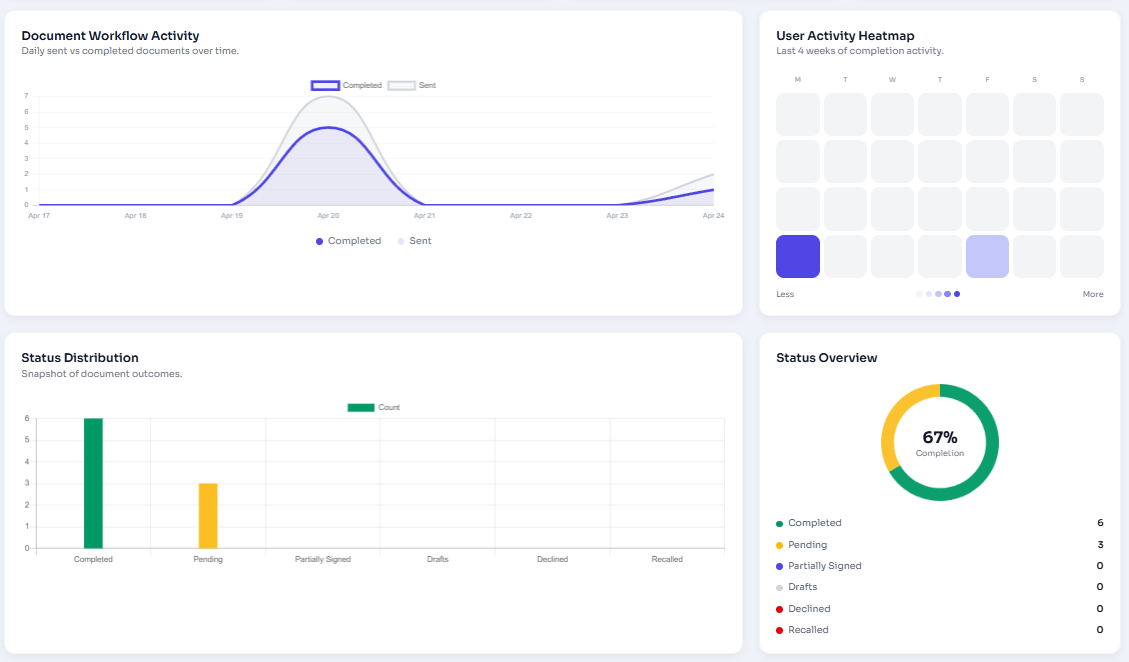
Figure 2: Workflow chart, activity heatmap, and status distribution charts.
Export Report Data
Click Export and choose the available format. Use exports when you need to share report data outside the portal or keep a local record.
Access Note
Report access may depend on your account role. If you cannot see reports, contact your organization administrator.